Octavio Gonzalez-LugoProtein animation with blenderProteins constitute the main components inside a cell, proteins are responsible for the cell function as well as structure. Once…Jan 16, 2020Jan 16, 2020
Octavio Gonzalez-LugoMaking a simple bar plot with blender and python.Visualizing data is one of the most useful skills, you can detect trends, changes, correlation, clusters and several attributes in the data…Feb 12, 2020Feb 12, 2020
Octavio Gonzalez-LugoMaking a simple scatter plot with blenderOne of the first visualizations taught at school is the representation of points in the cartesian plane. That simple visualization allows…Mar 4, 2020Mar 4, 2020
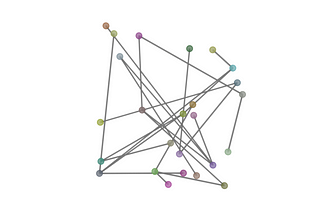
Octavio Gonzalez-LugoMaking networks with blenderNetworks also known as graphs are a collection of objects where an object is related to different objects. That relation is often…Mar 18, 20202Mar 18, 20202
Octavio Gonzalez-LugoMaking 2D plots with blenderIn this post, I will show you how to create a 2d data visualizations with blender.Apr 15, 2020Apr 15, 2020
Octavio Gonzalez-LugoProtein dashboard visualization with blenderViruses such as Covid-19 are biological entities that infect cells to reproduce itself. Once the virus introduces its genetic material to…Jun 3, 2020Jun 3, 2020
Octavio Gonzalez-LugoDisplaying the Covid-19 proteome as graphs with blender.As most of the biological entities that inhabit the planet, the Covid-19 virus is made of two principal components, the proteins that…Jun 24, 2020Jun 24, 2020
Octavio Gonzalez-LugoApplying different themes to data visualization with blender.A key component in any data visualization is the colors used for the elements in the visualization. From the lines and dots to the data and…Sep 2, 2020Sep 2, 2020
InGeek CulturebyOctavio Gonzalez-LugoVisualizing the Classifier Decision Function With SkLearn and Blender.One of the most common questions about machine learning is how does the algorithm makes decisions? In the case of deep learning, that is a…Apr 29, 2021Apr 29, 2021
Octavio Gonzalez-LugoMaking heat maps with blenderDisplaying a matrix with a heat map is one type of data visualization that allows us to understand pairwise relationships among features. A…May 12, 20211May 12, 20211